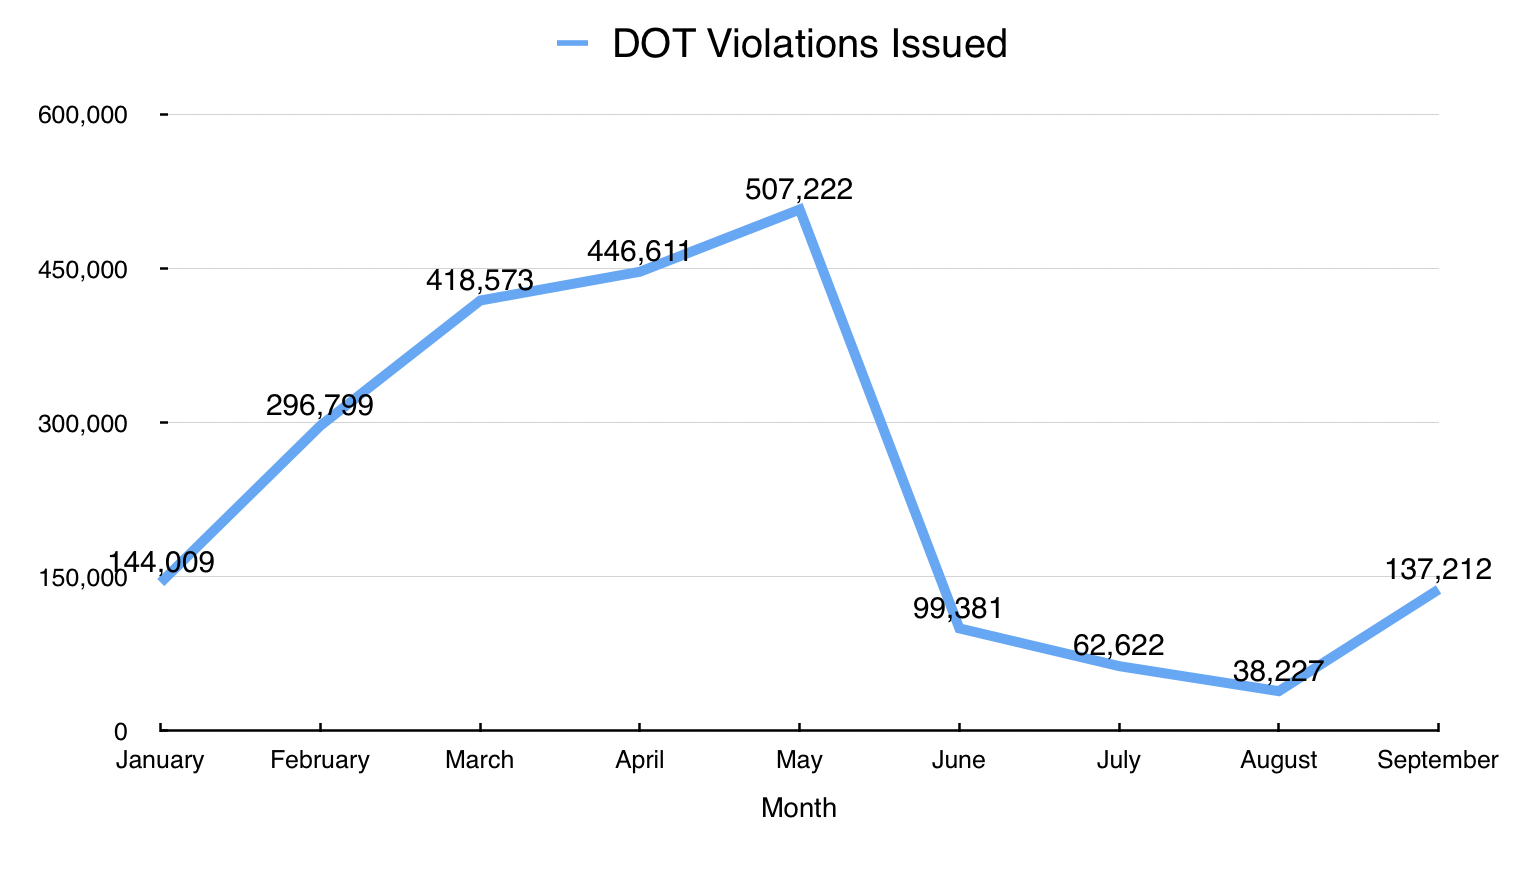
In September 2022 the DOT executed 262,785 inspections and issued 137,212 violations across the US. We take a look at the numbers of inspections and violations that were held in each state and see which FMCSA BASIC measure they enforced the most.
The violations are grouped together based on which BASIC category that they fall under. Some violations do not fall under a specific BASIC category and were not counted in the tables.
The "Vehicle Maintenance" category took the largest share of overall violations with 84,705 violations accounting for over 60% of the total violations issued in the US.
Read below to see how many inspections your state started and and how many of those inspections turned into violations.
Alabama
Inspections: 4,653
Violations: 2,373
| BASIC Violation Group | Violations | % of Total Violations |
| Unsafe Driving | 350 | 14.7% |
| Hours-of-Service | 295 | 12.4% |
| Vehicle Maintenance | 1,473 | 62% |
| Substance & Alcohol | 8 | .3% |
| Driver Fitness | 158 | 6.6% |
| Hazardous Materials | 2 | 0.08% |

Alaska
Inspections: 1,043
Violations: 287
| BASIC Violation Group | Violations | % of Total Violations |
| Unsafe Driving | 53 | 18.4% |
| Hours-of-Service | 3 | 1% |
| Vehicle Maintenance | 210 | 73% |
| Substance & Alcohol | 0 | 0% |
| Driver Fitness | 11 | 3.8% |
| Hazardous Materials | 1 | .35% |
Arizona
Inspections:5,713
Violations: 4,463
| BASIC Violation Group | Violations | % of Total Violations |
| Unsafe Driving | 735 | 16.5% |
| Hours-of-Service | 1,084 | 24.3% |
| Vehicle Maintenance | 2,295 | 51.4% |
| Substance & Alcohol | 24 | .53% |
| Driver Fitness | 133 | 3% |
| Hazardous Materials | 32 | .7% |
Arkansas
Inspections: 5,202
Violations: 2,229
| BASIC Violation Group | Violations | % of Total Violations |
| Unsafe Driving | 393 | 17.6% |
| Hours-of-Service | 261 | 11.7% |
| Vehicle Maintenance | 1,438 | 64.5% |
| Substance & Alcohol | 13 | .58% |
| Driver Fitness | 70 | 3% |
| Hazardous Materials | 15 | .67% |
California
Inspections: 38,518
Violations: 11,031
| BASIC Violation Group | Violations | % of Total Violations |
| Unsafe Driving | 3,441 | 31.2% |
| Hours-of-Service | 299 | 2% |
| Vehicle Maintenance | 6,527 | 59% |
| Substance & Alcohol | 15 | .13% |
| Driver Fitness | 207 | 1.9% |
| Hazardous Materials | 36 | .33% |
Colorado
Inspections: 3,349
Violations: 2,132
| BASIC Violation Group | Violations | % of Total Violations |
| Unsafe Driving | 375 | 17.6% |
| Hours-of-Service | 421 | 19.7% |
| Vehicle Maintenance | 1,111 | 52% |
| Substance & Alcohol | 14 | .65% |
| Driver Fitness | 78 | 3.7% |
| Hazardous Materials | 16 | .7% |
Connecticut
Inspections: 1,337
Violations: 1,275
| BASIC Violation Group | Violations | % of Total Violations |
| Unsafe Driving | 359 | 28.1% |
| Hours-of-Service | 166 | 13% |
| Vehicle Maintenance | 643 | 50% |
| Substance & Alcohol | 3 | .2% |
| Driver Fitness | 49 | 3.8% |
| Hazardous Materials | 2 | .15% |
Delaware
Inspections: 544
Violations: 280
| BASIC Violation Group | Violations | % of Total Violations |
| Unsafe Driving | 132 | 47% |
| Hours-of-Service | 17 | 6% |
| Vehicle Maintenance | 92 | 33% |
| Substance & Alcohol | 1 | .36% |
| Driver Fitness | 22 | 7.9% |
| Hazardous Materials | 0 | 0% |
Florida
Inspections: 7,135
Violations: 3,750
| BASIC Violation Group | Violations | % of Total Violations |
| Unsafe Driving | 861 | 23% |
| Hours-of-Service | 265 | 7% |
| Vehicle Maintenance | 2,189 | 58% |
| Substance & Alcohol | 8 | .21% |
| Driver Fitness | 194 | 5.1% |
| Hazardous Materials | 11 | .3% |
Georgia
Inspections: 6,081
Violations: 4,892
| BASIC Violation Group | Violations | % of Total Violations |
| Unsafe Driving | 1,013 | 20.7% |
| Hours-of-Service | 721 | 14.7% |
| Vehicle Maintenance | 2,629 | 53.7% |
| Substance & Alcohol | 24 | .49% |
| Driver Fitness | 261 | 5.3% |
| Hazardous Materials | 65 | 1.3% |
Hawaii
Inspections: 178
Violations: 84
| BASIC Violation Group | Violations | % of Total Violations |
| Unsafe Driving | 15 | 17.9% |
| Hours-of-Service | 0 | 0% |
| Vehicle Maintenance | 54 | 64% |
| Substance & Alcohol | 0 | 0% |
| Driver Fitness | 3 | 3.6% |
| Hazardous Materials | 0 | 0% |
Idaho
Inspections: 858
Violations: 987
| BASIC Violation Group | Violations | % of Total Violations |
| Unsafe Driving | 200 | 20.2% |
| Hours-of-Service | 129 | 13% |
| Vehicle Maintenance | 568 | 57.5% |
| Substance & Alcohol | 4 | .4% |
| Driver Fitness | 41 | 4.1% |
| Hazardous Materials | 6 | .6% |
Illinois
Inspections: 9,618
Violations: 1,513
| BASIC Violation Group | Violations | % of Total Violations |
| Unsafe Driving | 569 | 38% |
| Hours-of-Service | 136 | 9% |
| Vehicle Maintenance | 620 | 41% |
| Substance & Alcohol | 0 | 0% |
| Driver Fitness | 137 | 9% |
| Hazardous Materials | 7 | .46% |
Indiana
Inspections: 5,593
Violations: 3,422
| BASIC Violation Group | Violations | % of Total Violations |
| Unsafe Driving | 1,416 | 41.4% |
| Hours-of-Service | 537 | 15.7% |
| Vehicle Maintenance | 1,257 | 37% |
| Substance & Alcohol | 6 | .17% |
| Driver Fitness | 96 | 2.8% |
| Hazardous Materials | 4 | .11% |
Iowa
Inspections: 4,662
Violations: 1,499
| BASIC Violation Group | Violations | % of Total Violations |
| Unsafe Driving | 625 | 42% |
| Hours-of-Service | 246 | 16% |
| Vehicle Maintenance | 477 | 32% |
| Substance & Alcohol | 9 | .6% |
| Driver Fitness | 79 | 5.3% |
| Hazardous Materials | 6 | .4% |
Kansas
Inspections: 3,620
Violations: 1,319
| BASIC Violation Group | Violations | % of Total Violations |
| Unsafe Driving | 223 | 17% |
| Hours-of-Service | 207 | 15.7% |
| Vehicle Maintenance | 752 | 57% |
| Substance & Alcohol | 11 | .8% |
| Driver Fitness | 64 | 4.8% |
| Hazardous Materials | 9 | .7% |
Kentucky
Inspections: 5,927
Violations: 3,154
| BASIC Violation Group | Violations | % of Total Violations |
| Unsafe Driving | 951 | 30% |
| Hours-of-Service | 274 | 8.7% |
| Vehicle Maintenance | 1,610 | 51% |
| Substance & Alcohol | 7 | .2% |
| Driver Fitness | 103 | 3.3% |
| Hazardous Materials | 16 | .5% |
Louisiana
Inspections: 2,918
Violations: 1,709
| BASIC Violation Group | Violations | % of Total Violations |
| Unsafe Driving | 439 | 26% |
| Hours-of-Service | 146 | 8.5% |
| Vehicle Maintenance | 990 | 58% |
| Substance & Alcohol | 3 | .17% |
| Driver Fitness | 93 | 5.4% |
| Hazardous Materials | 13 | .76% |
Maine
Inspections: 1,818
Violations: 517
| BASIC Violation Group | Violations | % of Total Violations |
| Unsafe Driving | 125 | 24% |
| Hours-of-Service | 42 | 8.1% |
| Vehicle Maintenance | 308 | 60% |
| Substance & Alcohol | 0 | 0% |
| Driver Fitness | 18 | 3.5% |
| Hazardous Materials | 0 | 0% |
Maryland
Inspections: 9,054
Violations: 3,074
| BASIC Violation Group | Violations | % of Total Violations |
| Unsafe Driving | 682 | 22% |
| Hours-of-Service | 105 | 3.4% |
| Vehicle Maintenance | 1,807 | 59% |
| Substance & Alcohol | 8 | .26% |
| Driver Fitness | 256 | 8.3% |
| Hazardous Materials | 9 | .3% |
Massachusetts
Inspections: 1,503
Violations: 1,511
| BASIC Violation Group | Violations | % of Total Violations |
| Unsafe Driving | 494 | 33% |
| Hours-of-Service | 63 | 4% |
| Vehicle Maintenance | 654 | 43% |
| Substance & Alcohol | 4 | .26% |
| Driver Fitness | 131 | 8.7% |
| Hazardous Materials | 8 | .52 |
Michigan
Inspections: 4,392
Violations: 3,449
| BASIC Violation Group | Violations | % of Total Violations |
| Unsafe Driving | 1,426 | 41.3% |
| Hours-of-Service | 177 | 5.1% |
| Vehicle Maintenance | 1,436 | 41.6% |
| Substance & Alcohol | 7 | .2% |
| Driver Fitness | 156 | 4.5% |
| Hazardous Materials | 14 | .4% |
Minnesota
Inspections: 2,824
Violations: 2,038
| BASIC Violation Group | Violations | % of Total Violations |
| Unsafe Driving | 689 | 34% |
| Hours-of-Service | 134 | 6.6% |
| Vehicle Maintenance | 1,044 | 51.2% |
| Substance & Alcohol | 8 | .39% |
| Driver Fitness | 86 | 4.2% |
| Hazardous Materials | 17 | .83% |
Mississippi
Inspections: 5,217
Violations: 1,229
| BASIC Violation Group | Violations | % of Total Violations |
| Unsafe Driving | 218 | 17.7% |
| Hours-of-Service | 185 | 15% |
| Vehicle Maintenance | 638 | 52% |
| Substance & Alcohol | 35 | 2.8% |
| Driver Fitness | 85 | 6.9% |
| Hazardous Materials | 2 | .16% |
Missouri
Inspections: 5,186
Violations: 3,701
| BASIC Violation Group | Violations | % of Total Violations |
| Unsafe Driving | 586 | 15.8% |
| Hours-of-Service | 644 | 17.4% |
| Vehicle Maintenance | 2,228 | 60% |
| Substance & Alcohol | 10 | .27% |
| Driver Fitness | 125 | 3.4% |
| Hazardous Materials | 21 | .56% |
Avoid HOS violations with the Blue Ink Tech logbook app
Montana
Inspections: 3,143
Violations: 541
| BASIC Violation Group | Violations | % of Total Violations |
| Unsafe Driving | 74 | 13.7% |
| Hours-of-Service | 92 | 17% |
| Vehicle Maintenance | 321 | 59% |
| Substance & Alcohol | 3 | .55% |
| Driver Fitness | 25 | 4.6% |
| Hazardous Materials | 8 | 1.4% |
Nebraska
Inspections: 2,774
Violations: 2,300
| BASIC Violation Group | Violations | % of Total Violations |
| Unsafe Driving | 733 | 32% |
| Hours-of-Service | 320 | 14% |
| Vehicle Maintenance | 991 | 43% |
| Substance & Alcohol | 7 | .3% |
| Driver Fitness | 90 | 3.9% |
| Hazardous Materials | 16 | .7% |
Nevada
Inspections: 1,919
Violations: 613
| BASIC Violation Group | Violations | % of Total Violations |
| Unsafe Driving | 103 | 16.8% |
| Hours-of-Service | 83 | 13.5% |
| Vehicle Maintenance | 345 | 56% |
| Substance & Alcohol | 1 | .16% |
| Driver Fitness | 32 | 5.2% |
| Hazardous Materials | 5 | .8% |
New Hampshire
Inspections: 1,019
Violations: 299
| BASIC Violation Group | Violations | % of Total Violations |
| Unsafe Driving | 89 | 29.7% |
| Hours-of-Service | 17 | 5.7% |
| Vehicle Maintenance | 122 | 41% |
| Substance & Alcohol | 3 | 1% |
| Driver Fitness | 49 | 16.4% |
| Hazardous Materials | 2 | .67% |
New Jersey
Inspections: 1,443
Violations: 2,293
| BASIC Violation Group | Violations | % of Total Violations |
| Unsafe Driving | 411 | 18% |
| Hours-of-Service | 34 | 1.5% |
| Vehicle Maintenance | 1,374 | 60% |
| Substance & Alcohol | 5 | .2% |
| Driver Fitness | 224 | 9.8% |
| Hazardous Materials | 31 | 1.4% |
New Mexico
Inspections: 9,979
Violations: 2,587
| BASIC Violation Group | Violations | % of Total Violations |
| Unsafe Driving | 648 | 25% |
| Hours-of-Service | 246 | 9.5% |
| Vehicle Maintenance | 1,544 | 59.7% |
| Substance & Alcohol | 10 | .38% |
| Driver Fitness | 55 | 2.1% |
| Hazardous Materials | 13 | .5% |
New York
Inspections: 10,016
Violations: 6,055
| BASIC Violation Group | Violations | % of Total Violations |
| Unsafe Driving | 1,235 | 20.4% |
| Hours-of-Service | 427 | 7% |
| Vehicle Maintenance | 3,414 | 56% |
| Substance & Alcohol | 13 | .2% |
| Driver Fitness | 345 | 5.7% |
| Hazardous Materials | 49 | .8% |
North Carolina
Inspections: 7,939
Violations: 2,204
| BASIC Violation Group | Violations | % of Total Violations |
| Unsafe Driving | 443 | 20% |
| Hours-of-Service | 195 | 8.9% |
| Vehicle Maintenance | 1,262 | 57% |
| Substance & Alcohol | 11 | .5% |
| Driver Fitness | 163 | 7.4% |
| Hazardous Materials | 6 | .27% |
North Dakota
Inspections: 1,163
Violations: 799
| BASIC Violation Group | Violations | % of Total Violations |
| Unsafe Driving | 101 | 12.6% |
| Hours-of-Service | 106 | 13.2% |
| Vehicle Maintenance | 558 | 70% |
| Substance & Alcohol | 5 | .62% |
| Driver Fitness | 16 | 2% |
| Hazardous Materials | 1 | .125% |
Ohio
Inspections: 5,447
Violations: 2,241
| BASIC Violation Group | Violations | % of Total Violations |
| Unsafe Driving | 533 | 23.7% |
| Hours-of-Service | 278 | 12.4% |
| Vehicle Maintenance | 1,250 | 56% |
| Substance & Alcohol | 3 | .13% |
| Driver Fitness | 89 | 4% |
| Hazardous Materials | 17 | .75% |
Oklahoma
Inspections: 3,476
Violations: 1,759
| BASIC Violation Group | Violations | % of Total Violations |
| Unsafe Driving | 490 | 28% |
| Hours-of-Service | 131 | 7.4% |
| Vehicle Maintenance | 974 | 55% |
| Substance & Alcohol | 3 | .17% |
| Driver Fitness | 85 | 4.8% |
| Hazardous Materials | 14 | .8% |
Oregon
Inspections: 1,971
Violations: 814
| BASIC Violation Group | Violations | % of Total Violations |
| Unsafe Driving | 122 | 15% |
| Hours-of-Service | 193 | 24% |
| Vehicle Maintenance | 432 | 53% |
| Substance & Alcohol | 3 | .36% |
| Driver Fitness | 37 | 4.5% |
| Hazardous Materials | 1 | .12% |
Pennsylvania
Inspections: 6,907
Violations: 5,035
| BASIC Violation Group | Violations | % of Total Violations |
| Unsafe Driving | 1,497 | 29.7% |
| Hours-of-Service | 414 | 8.2% |
| Vehicle Maintenance | 2,517 | 50% |
| Substance & Alcohol | 9 | .17% |
| Driver Fitness | 293 | 5.8% |
| Hazardous Materials | 1 | .01% |
Rhode Island
Inspections: 539
Violations: 1,195
| BASIC Violation Group | Violations | % of Total Violations |
| Unsafe Driving | 386 | 32.3% |
| Hours-of-Service | 25 | 2% |
| Vehicle Maintenance | 596 | 49.9% |
| Substance & Alcohol | 4 | .3% |
| Driver Fitness | 105 | 8.8% |
| Hazardous Materials | 4 | .33% |
South Carolina
Inspections: 3,695
Violations: 1,415
| BASIC Violation Group | Violations | % of Total Violations |
| Unsafe Driving | 489 | 35% |
| Hours-of-Service | 114 | 8% |
| Vehicle Maintenance | 695 | 49% |
| Substance & Alcohol | 6 | .4% |
| Driver Fitness | 69 | 4.8% |
| Hazardous Materials | 16 | 1.1% |
South Dakota
Inspections: 2,218
Violations: 163
| BASIC Violation Group | Violations | % of Total Violations |
| Unsafe Driving | 59 | 36% |
| Hours-of-Service | 15 | 9% |
| Vehicle Maintenance | 81 | 49.6% |
| Substance & Alcohol | 0 | 0% |
| Driver Fitness | 7 | 4.2% |
| Hazardous Materials | 0 | 0% |
Tennessee
Inspections: 6,900
Violations: 2,239
| BASIC Violation Group | Violations | % of Total Violations |
| Unsafe Driving | 667 | 29.8% |
| Hours-of-Service | 268 | 12% |
| Vehicle Maintenance | 1,077 | 48% |
| Substance & Alcohol | 10 | .4% |
| Driver Fitness | 117 | 5.2% |
| Hazardous Materials | 9 | .4% |

Texas
Inspections: 26,570
Violations: 27,320
| BASIC Violation Group | Violations | % of Total Violations |
| Unsafe Driving | 2,341 | 8.5% |
| Hours-of-Service | 1,224 | 4.5% |
| Vehicle Maintenance | 22,249 | 81.4% |
| Substance & Alcohol | 29 | .1% |
| Driver Fitness | 681 | 2.5% |
| Hazardous Materials | 145 | .5% |
Utah
Inspections: 3,667
Violations: 1,804
| BASIC Violation Group | Violations | % of Total Violations |
| Unsafe Driving | 402 | 22.2% |
| Hours-of-Service | 337 | 18.6% |
| Vehicle Maintenance | 936 | 52% |
| Substance & Alcohol | 11 | .6% |
| Driver Fitness | 54 | 3% |
| Hazardous Materials | 8 | .4% |
Vermont
Inspections: 650
Violations: 240
| BASIC Violation Group | Violations | % of Total Violations |
| Unsafe Driving | 44 | 18.3% |
| Hours-of-Service | 20 | 8.3% |
| Vehicle Maintenance | 147 | 61.3% |
| Substance & Alcohol | 0 | 0% |
| Driver Fitness | 14 | 5.8% |
| Hazardous Materials | 0 | 0% |
Virginia
Inspections: 2,895
Violations: 1,633
| BASIC Violation Group | Violations | % of Total Violations |
| Unsafe Driving | 186 | 11.4% |
| Hours-of-Service | 164 | 10% |
| Vehicle Maintenance | 1,118 | 68.5% |
| Substance & Alcohol | 5 | .3% |
| Driver Fitness | 68 | 4.1% |
| Hazardous Materials | 8 | .5% |
Washington
Inspections: 6,611
Violations: 3,623
| BASIC Violation Group | Violations | % of Total Violations |
| Unsafe Driving | 1,259 | 35% |
| Hours-of-Service | 418 | 11.5% |
| Vehicle Maintenance | 1,590 | 44% |
| Substance & Alcohol | 7 | .2% |
| Driver Fitness | 137 | 3.8% |
| Hazardous Materials | 7 | .2% |
West Virginia
Inspections: 1,989
Violations: 579
| BASIC Violation Group | Violations | % of Total Violations |
| Unsafe Driving | 203 | 35% |
| Hours-of-Service | 29 | 5% |
| Vehicle Maintenance | 246 | 42% |
| Substance & Alcohol | 1 | .17% |
| Driver Fitness | 44 | 7.6% |
| Hazardous Materials | 0 | 0% |
Wisconsin
Inspections: 3,122
Violations: 2,740
| BASIC Violation Group | Violations | % of Total Violations |
| Unsafe Driving | 807 | 29.5% |
| Hours-of-Service | 138 | 5% |
| Vehicle Maintenance | 1,473 | 54% |
| Substance & Alcohol | 6 | .2% |
| Driver Fitness | 84 | 3% |
| Hazardous Materials | 14 | .5% |
Wyoming
Inspections: 2,093
Violations: 1,276
| BASIC Violation Group | Violations | % of Total Violations |
| Unsafe Driving | 179 | 14% |
| Hours-of-Service | 248 | 19% |
| Vehicle Maintenance | 698 | 55% |
| Substance & Alcohol | 6 | .5% |
| Driver Fitness | 70 | 5.5% |
| Hazardous Materials | 4 | .3% |