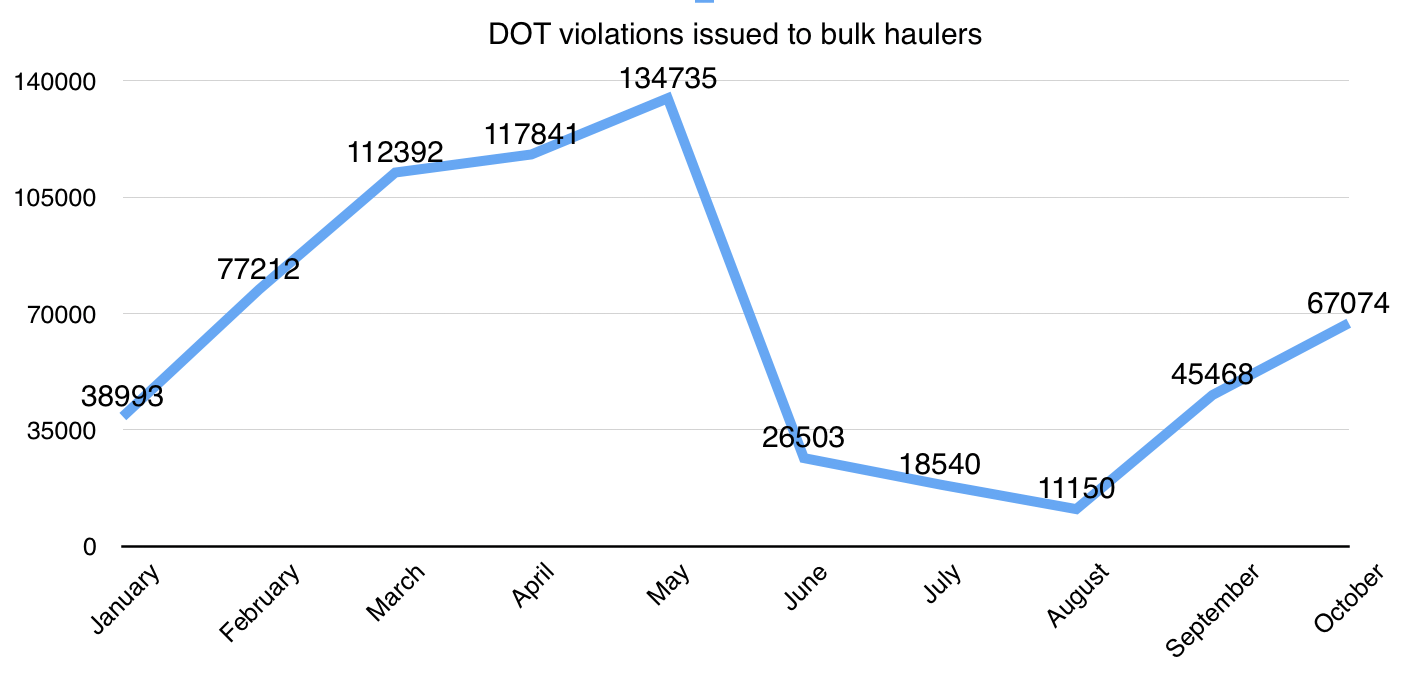
So far in 2022 the Department of Transportation (DOT) executed over 725,000 inspections and issued 649,000 violations to bulk commodity haulers across the US. We take a look at the numbers of inspections and violations that were held in each state and see which FMCSA BASIC measure were enforced the most.
 The violations are grouped together based on which BASIC category that they fall under. Some violations do not fall under a specific BASIC category and were not counted in the tables.
The commodities that were used in this report come from the FMCSAs Motor Carrier Management Information System (MCMIS). Carriers who reported hauling the following commodities were used:
- Livestock
- Produce
- Grain/feed
- Meat
- Drybulk
- Cold food
- Beverages
- Farm supply
Read below to see how many inspections your state started and and how many of those inspections turned into violations.
Alabama
Inspections: 9,108
Violations: 7,065
| BASIC Violation Group | Violations | % of Total Violations |
| Unsafe Driving | 1,042 | 14.7% |
| Hours-of-Service | 914 | 12.9% |
| Vehicle Maintenance | 4,723 | 66.9% |
| Substance & Alcohol | 30 | 0.4% |
| Driver Fitness | 333 | 4.7% |
| Hazardous Materials | 23 | 0.3% |

Alaska
Inspections: 1,924
Violations: 1,129
| BASIC Violation Group | Violations | % of Total Violations |
| Unsafe Driving | 242 | 21.4% |
| Hours-of-Service | 20 | 1.7% |
| Vehicle Maintenance | 821 | 72.7% |
| Substance & Alcohol | 0 | 0% |
| Driver Fitness | 26 | 2.3% |
| Hazardous Materials | 20 | 1.7% |
Arizona
Inspections: 15,034
Violations: 21,624
| BASIC Violation Group | Violations | % of Total Violations |
| Unsafe Driving | 3,436 | 15.9% |
| Hours-of-Service | 4,934 | 22.8% |
| Vehicle Maintenance | 12,591 | 58.2% |
| Substance & Alcohol | 76 | 0.35% |
| Driver Fitness | 399 | 1.85% |
| Hazardous Materials | 188 | 0.87% |
Arkansas
Inspections: 10,781
Violations: 7,998
| BASIC Violation Group | Violations | % of Total Violations |
| Unsafe Driving | 2,283 | 28.5% |
| Hours-of-Service | 1,226 | 15.3% |
| Vehicle Maintenance | 4,245 | 53.1% |
| Substance & Alcohol | 40 | 0.5% |
| Driver Fitness | 177 | 2.2% |
| Hazardous Materials | 27 | 0.34% |
California
Inspections: 116,313
Violations: 55,633
| BASIC Violation Group | Violations | % of Total Violations |
| Unsafe Driving | 15,300 | 27.5% |
| Hours-of-Service | 2,216 | 4% |
| Vehicle Maintenance | 37,136 | 66.8% |
| Substance & Alcohol | 76 | 0.14% |
| Driver Fitness | 721 | 1.3% |
| Hazardous Materials | 184 | 0.3% |
Colorado
Inspections: 10,578
Violations: 12,237
| BASIC Violation Group | Violations | % of Total Violations |
| Unsafe Driving | 2,489 | 20.3% |
| Hours-of-Service | 3,693 | 30.2% |
| Vehicle Maintenance | 5,608 | 46% |
| Substance & Alcohol | 59 | 0.5% |
| Driver Fitness | 357 | 2.9% |
| Hazardous Materials | 31 | 0.25% |
Connecticut
Inspections: 2,346
Violations: 4,393
| BASIC Violation Group | Violations | % of Total Violations |
| Unsafe Driving | 1,379 | 31.4% |
| Hours-of-Service | 668 | 15.2% |
| Vehicle Maintenance | 2,176 | 49.5% |
| Substance & Alcohol | 6 | 0.14% |
| Driver Fitness | 143 | 3.3% |
| Hazardous Materials | 21 |
Delaware
Inspections: 1,734
Violations: 1,348
| BASIC Violation Group | Violations | % of Total Violations |
| Unsafe Driving | 592 | 43.9% |
| Hours-of-Service | 67 | 5.0% |
| Vehicle Maintenance | 640 | 47.5% |
| Substance & Alcohol | 5 | 0.4% |
| Driver Fitness | 43 | 3.2% |
| Hazardous Materials | 1 | 0.1% |
Florida
Inspections: 14,328
Violations: 14,698
| BASIC Violation Group | Violations | % of Total Violations |
| Unsafe Driving | 3,706 | 25.2% |
| Hours-of-Service | 1,593 | 10.8% |
| Vehicle Maintenance | 8,890 | 60.5% |
| Substance & Alcohol | 21 | 0.1% |
| Driver Fitness | 423 | 2.9% |
| Hazardous Materials | 65 | 0.4% |
Georgia
Inspections: 17,549
Violations: 21,022
| BASIC Violation Group | Violations | % of Total Violations |
| Unsafe Driving | 7,604 | 36.2% |
| Hours-of-Service | 4,594 | 21.9% |
| Vehicle Maintenance | 7,857 | 37.4% |
| Substance & Alcohol | 134 | 0.6% |
| Driver Fitness | 610 | 2.9% |
| Hazardous Materials | 223 | 1.1% |
Hawaii
Inspections: 753
Violations: 777
| BASIC Violation Group | Violations | % of Total Violations |
| Unsafe Driving | 95 | 12.2% |
| Hours-of-Service | 0 | 0% |
| Vehicle Maintenance | 634 | 81.6% |
| Substance & Alcohol | 0 | 0% |
| Driver Fitness | 41 | 5.3% |
| Hazardous Materials | 7 | 0.9% |
Idaho
Inspections: 3,556
Violations: 4,853
| BASIC Violation Group | Violations | % of Total Violations |
| Unsafe Driving | 993 | 20.5% |
| Hours-of-Service | 744 | 15.3% |
| Vehicle Maintenance | 2,949 | 60.8% |
| Substance & Alcohol | 15 | 0.3% |
| Driver Fitness | 84 | 1.7% |
| Hazardous Materials | 68 | 1.4% |
Illinois
Inspections: 21,800
Violations: 10,443
| BASIC Violation Group | Violations | % of Total Violations |
| Unsafe Driving | 4,178 | 40.0% |
| Hours-of-Service | 1,034 | 9.9% |
| Vehicle Maintenance | 4,826 | 46.2% |
| Substance & Alcohol | 22 | 0.2% |
| Driver Fitness | 298 | 2.9% |
| Hazardous Materials | 85 | 0.8% |
Indiana
Inspections: 16,329
Violations: 16,831
| BASIC Violation Group | Violations | % of Total Violations |
| Unsafe Driving | 8,153 | 48.4% |
| Hours-of-Service | 2,903 | 17.2% |
| Vehicle Maintenance | 5,418 | 32.2% |
| Substance & Alcohol | 39 | 0.2% |
| Driver Fitness | 270 | 1.6% |
| Hazardous Materials | 48 | 0.3% |
Iowa
Inspections: 17,655
Violations: 19,479
| BASIC Violation Group | Violations | % of Total Violations |
| Unsafe Driving | 9,190 | 47.2% |
| Hours-of-Service | 2,367 | 12.2% |
| Vehicle Maintenance | 7,217 | 37.1% |
| Substance & Alcohol | 49 | 0.3% |
| Driver Fitness | 467 | 2.4% |
| Hazardous Materials | 189 | 1.0% |
Kansas
Inspections: 13,050
Violations: 10,920
| BASIC Violation Group | Violations | % of Total Violations |
| Unsafe Driving | 2,134 | 19.5% |
| Hours-of-Service | 1,486 | 13.6% |
| Vehicle Maintenance | 6,931 | 63.5% |
| Substance & Alcohol | 49 | 0.4% |
| Driver Fitness | 244 | 2.2% |
| Hazardous Materials | 76 | 0.7% |
Kentucky
Inspections: 16,086
Violations: 14,446
| BASIC Violation Group | Violations | % of Total Violations |
| Unsafe Driving | 5,002 | 34.6% |
| Hours-of-Service | 1,255 | 8.7% |
| Vehicle Maintenance | 7,778 | 53.8% |
| Substance & Alcohol | 55 | 0.4% |
| Driver Fitness | 305 | 2.1% |
| Hazardous Materials | 51 | 0.4% |
Louisiana
Inspections: 7,491
Violations: 5,469
| BASIC Violation Group | Violations | % of Total Violations |
| Unsafe Driving | 1,600 | 29.3% |
| Hours-of-Service | 839 | 15.3% |
| Vehicle Maintenance | 2,797 | 51.1% |
| Substance & Alcohol | 36 | 0.7% |
| Driver Fitness | 148 | 2.7% |
| Hazardous Materials | 49 | 0.9% |
Maine
Inspections: 4,842
Violations: 3,347
| BASIC Violation Group | Violations | % of Total Violations |
| Unsafe Driving | 468 | 14.0% |
| Hours-of-Service | 682 | 20.4% |
| Vehicle Maintenance | 2,067 | 61.8% |
| Substance & Alcohol | 11 | 0.3% |
| Driver Fitness | 112 | 3.3% |
| Hazardous Materials | 7 | 0.2% |
Maryland
Inspections: 15,906
Violations: 11,250
| BASIC Violation Group | Violations | % of Total Violations |
| Unsafe Driving | 2,449 | 21.8% |
| Hours-of-Service | 504 | 4.5% |
| Vehicle Maintenance | 7,610 | 67.6% |
| Substance & Alcohol | 49 | 0.4% |
| Driver Fitness | 595 | 5.3% |
| Hazardous Materials | 43 | 0.4% |
Massachusetts
Inspections: 1,732
Violations: 3,285
| BASIC Violation Group | Violations | % of Total Violations |
| Unsafe Driving | 1,154 | 35.1% |
| Hours-of-Service | 288 | 8.8% |
| Vehicle Maintenance | 1,645 | 50.1% |
| Substance & Alcohol | 12 | 0.4% |
| Driver Fitness | 174 | 5.3% |
| Hazardous Materials | 12 | 0.4% |
Michigan
Inspections: 11,183
Violations: 13,698
| BASIC Violation Group | Violations | % of Total Violations |
| Unsafe Driving | 6,167 | 45.0% |
| Hours-of-Service | 780 | 5.7% |
| Vehicle Maintenance | 6,232 | 45.5% |
| Substance & Alcohol | 21 | 0.2% |
| Driver Fitness | 324 | 2.4% |
| Hazardous Materials | 174 | 1.3% |
Minnesota
Inspections: 8,618
Violations: 9,871
| BASIC Violation Group | Violations | % of Total Violations |
| Unsafe Driving | 3,790 | 38.4% |
| Hours-of-Service | 1,542 | 15.6% |
| Vehicle Maintenance | 4,253 | 43..1% |
| Substance & Alcohol | 20 | 0.2% |
| Driver Fitness | 152 | 1.5% |
| Hazardous Materials | 114 | 1.2% |
Mississippi
Inspections: 18,031
Violations: 6,346
| BASIC Violation Group | Violations | % of Total Violations |
| Unsafe Driving | 1,133 | 17.9% |
| Hours-of-Service | 808 | 12.7% |
| Vehicle Maintenance | 4,127 | 65.0% |
| Substance & Alcohol | 64 | 1.0% |
| Driver Fitness | 159 | 2.5% |
| Hazardous Materials | 55 | 0.9% |
Missouri
Inspections: 17,188
Violations: 14,303
| BASIC Violation Group | Violations | % of Total Violations |
| Unsafe Driving | 3,184 | 22.3% |
| Hours-of-Service | 2,296 | 16.1% |
| Vehicle Maintenance | 8,309 | 58.1% |
| Substance & Alcohol | 51 | 0.4% |
| Driver Fitness | 285 | 2.0% |
| Hazardous Materials | 178 | 1.2% |
Avoid HOS violations with the Blue Ink Tech logbook app
Montana
Inspections: 12,675
Violations: 5,121
| BASIC Violation Group | Violations | % of Total Violations |
| Unsafe Driving | 744 | 14.5% |
| Hours-of-Service | 716 | 14.0% |
| Vehicle Maintenance | 3,488 | 68.1% |
| Substance & Alcohol | 27 | 0.5% |
| Driver Fitness | 99 | 1.9% |
| Hazardous Materials | 47 | 0.9% |
Nebraska
Inspections: 9,637
Violations: 6,348
| BASIC Violation Group | Violations | % of Total Violations |
| Unsafe Driving | 2,725 | 42.9% |
| Hours-of-Service | 1,204 | 19.0% |
| Vehicle Maintenance | 2,165 | 34.1% |
| Substance & Alcohol | 18 | 0.3% |
| Driver Fitness | 184 | 2.9% |
| Hazardous Materials | 52 | 0.8% |
Nevada
Inspections: 6,531
Violations: 3,796
| BASIC Violation Group | Violations | % of Total Violations |
| Unsafe Driving | 811 | 21.4% |
| Hours-of-Service | 705 | 18.6% |
| Vehicle Maintenance | 2,108 | 55.5% |
| Substance & Alcohol | 10 | 0.3% |
| Driver Fitness | 148 | 3.9% |
| Hazardous Materials | 14 | 0.4% |
New Hampshire
Inspections: 1,407
Violations: 1,029
| BASIC Violation Group | Violations | % of Total Violations |
| Unsafe Driving | 203 | 19.7% |
| Hours-of-Service | 165 | 16.0% |
| Vehicle Maintenance | 578 | 56.2% |
| Substance & Alcohol | 2 | 0.2% |
| Driver Fitness | 77 | 7.5% |
| Hazardous Materials | 4 | 0.4% |
New Jersey
Inspections: 4,926
Violations: 4,632
| BASIC Violation Group | Violations | % of Total Violations |
| Unsafe Driving | 1,189 | 25.7% |
| Hours-of-Service | 199 | 4.3% |
| Vehicle Maintenance | 2,785 | 60.1% |
| Substance & Alcohol | 5 | 0.1% |
| Driver Fitness | 404 | 8.7% |
| Hazardous Materials | 50 | 1.1% |
New Mexico
Inspections: 25,712
Violations: 11,839
| BASIC Violation Group | Violations | % of Total Violations |
| Unsafe Driving | 3,441 | 29.1% |
| Hours-of-Service | 1,363 | 11.5% |
| Vehicle Maintenance | 6,792 | 57.4% |
| Substance & Alcohol | 26 | 0.2% |
| Driver Fitness | 191 | 1.6% |
| Hazardous Materials | 26 | 0.2% |
New York
Inspections: 24,435
Violations: 19,576
| BASIC Violation Group | Violations | % of Total Violations |
| Unsafe Driving | 4,206 | 21.5% |
| Hours-of-Service | 3,146 | 16.1% |
| Vehicle Maintenance | 11,345 | 58.0% |
| Substance & Alcohol | 34 | 0.2% |
| Driver Fitness | 727 | 3.7% |
| Hazardous Materials | 118 | 0.6% |
North Carolina
Inspections: 25,585
Violations: 9,275
| BASIC Violation Group | Violations | % of Total Violations |
| Unsafe Driving | 2,502 | 27.0% |
| Hours-of-Service | 1,098 | 11.8% |
| Vehicle Maintenance | 5,261 | 56.7% |
| Substance & Alcohol | 45 | 0.5% |
| Driver Fitness | 342 | 3.7% |
| Hazardous Materials | 27 | 0.3% |
North Dakota
Inspections: 3,594
Violations: 3,130
| BASIC Violation Group | Violations | % of Total Violations |
| Unsafe Driving | 510 | 16.3% |
| Hours-of-Service | 295 | 9.4% |
| Vehicle Maintenance | 2,271 | 72.6% |
| Substance & Alcohol | 10 | 0.3% |
| Driver Fitness | 31 | 1.0% |
| Hazardous Materials | 13 | 0.4% |
Ohio
Inspections: 14,441
Violations: 11,323
| BASIC Violation Group | Violations | % of Total Violations |
| Unsafe Driving | 2,936 | 25.9% |
| Hours-of-Service | 1,356 | 12.0% |
| Vehicle Maintenance | 6,434 | 56.8% |
| Substance & Alcohol | 43 | 0.4% |
| Driver Fitness | 216 | 1.9% |
| Hazardous Materials | 338 | 3.0% |
Oklahoma
Inspections: 10,198
Violations: 12,635
| BASIC Violation Group | Violations | % of Total Violations |
| Unsafe Driving | 3,753 | 29.7% |
| Hours-of-Service | 1,250 | 9.9% |
| Vehicle Maintenance | 7,240 | 57.3% |
| Substance & Alcohol | 44 | 0.3% |
| Driver Fitness | 260 | 2.1% |
| Hazardous Materials | 88 | 0.7% |
Oregon
Inspections: 6,204
Violations: 6,486
| BASIC Violation Group | Violations | % of Total Violations |
| Unsafe Driving | 722 | 11.1% |
| Hours-of-Service | 2,335 | 36.0% |
| Vehicle Maintenance | 3,145 | 48.5% |
| Substance & Alcohol | 39 | 0.6% |
| Driver Fitness | 222 | 3.4% |
| Hazardous Materials | 23 | 0.4% |
Pennsylvania
Inspections: 17,215
Violations: 25,115
| BASIC Violation Group | Violations | % of Total Violations |
| Unsafe Driving | 9,085 | 36.2% |
| Hours-of-Service | 2,771 | 11.0% |
| Vehicle Maintenance | 12,311 | 49.0% |
| Substance & Alcohol | 35 | 0.1% |
| Driver Fitness | 870 | 3.5% |
| Hazardous Materials | 43 | 0.2% |
Rhode Island
Inspections: 605
Violations: 1,356
| BASIC Violation Group | Violations | % of Total Violations |
| Unsafe Driving | 573 | 42.3% |
| Hours-of-Service | 124 | 9.1% |
| Vehicle Maintenance | 565 | 41.7% |
| Substance & Alcohol | 6 | 0.4% |
| Driver Fitness | 85 | 6.3% |
| Hazardous Materials | 3 | 0.2% |
South Carolina
Inspections: 11,039
Violations: 11,788
| BASIC Violation Group | Violations | % of Total Violations |
| Unsafe Driving | 4,048 | 34.3% |
| Hours-of-Service | 1,133 | 9.6% |
| Vehicle Maintenance | 6,128 | 52.0% |
| Substance & Alcohol | 46 | 0.4% |
| Driver Fitness | 262 | 2.2% |
| Hazardous Materials | 171 | 1.5% |
South Dakota
Inspections: 10,262
Violations: 5,104
| BASIC Violation Group | Violations | % of Total Violations |
| Unsafe Driving | 1,459 | 28.6% |
| Hours-of-Service | 913 | 17.9% |
| Vehicle Maintenance | 2,525 | 49.5% |
| Substance & Alcohol | 26 | 0.5% |
| Driver Fitness | 146 | 2.9% |
| Hazardous Materials | 35 | 0.7% |
Tennessee
Inspections: 19,461
Violations: 9,256
| BASIC Violation Group | Violations | % of Total Violations |
| Unsafe Driving | 3,378 | 36.5% |
| Hours-of-Service | 1,050 | 11.3% |
| Vehicle Maintenance | 4,494 | 48.6% |
| Substance & Alcohol | 62 | 0.7% |
| Driver Fitness | 235 | 2.5% |
| Hazardous Materials | 37 | 0.4% |

Texas
Inspections: 68,967
Violations: 107,409
| BASIC Violation Group | Violations | % of Total Violations |
| Unsafe Driving | 8,169 | 7.6% |
| Hours-of-Service | 5,794 | 5.4% |
| Vehicle Maintenance | 91,197 | 84.9% |
| Substance & Alcohol | 90 | 0.1% |
| Driver Fitness | 1,385 | 1.3% |
| Hazardous Materials | 774 | 0.7% |
Utah
Inspections: 12,594
Violations: 8,684
| BASIC Violation Group | Violations | % of Total Violations |
| Unsafe Driving | 1,937 | 22.3% |
| Hours-of-Service | 1,878 | 21.6% |
| Vehicle Maintenance | 4,654 | 53.6% |
| Substance & Alcohol | 39 | 0.4% |
| Driver Fitness | 146 | 1.7% |
| Hazardous Materials | 30 | 0.3% |
Vermont
Inspections: 1,776
Violations: 1,836
| BASIC Violation Group | Violations | % of Total Violations |
| Unsafe Driving | 405 | 22.1% |
| Hours-of-Service | 154 | 8.4% |
| Vehicle Maintenance | 1,230 | 67.0% |
| Substance & Alcohol | 8 | 0.4% |
| Driver Fitness | 25 | 1.4% |
| Hazardous Materials | 14 | 0.8% |
Virginia
Inspections: 6,277
Violations: 7,071
| BASIC Violation Group | Violations | % of Total Violations |
| Unsafe Driving | 789 | 11.2% |
| Hours-of-Service | 759 | 10.7% |
| Vehicle Maintenance | 5,351 | 75.7% |
| Substance & Alcohol | 14 | 0.2% |
| Driver Fitness | 113 | 1.6% |
| Hazardous Materials | 45 | 0.6% |
Washington
Inspections: 22,193
Violations: 18,127
| BASIC Violation Group | Violations | % of Total Violations |
| Unsafe Driving | 6,613 | 36.5% |
| Hours-of-Service | 2,593 | 14.3% |
| Vehicle Maintenance | 8,427 | 46.5% |
| Substance & Alcohol | 38 | 0.2% |
| Driver Fitness | 398 | 2.2% |
| Hazardous Materials | 58 | 0.3% |
West Virginia
Inspections: 3,623
Violations: 2,260
| BASIC Violation Group | Violations | % of Total Violations |
| Unsafe Driving | 1,250 | 55.3% |
| Hours-of-Service | 238 | 10.5% |
| Vehicle Maintenance | 699 | 30.9% |
| Substance & Alcohol | 5 | 0.2% |
| Driver Fitness | 66 | 2.9% |
| Hazardous Materials | 2 | 0.1% |
Wisconsin
Inspections: 9,169
Violations: 11,393
| BASIC Violation Group | Violations | % of Total Violations |
| Unsafe Driving | 3,698 | 32.5% |
| Hours-of-Service | 1,046 | 9.2% |
| Vehicle Maintenance | 6,376 | 56.0% |
| Substance & Alcohol | 24 | 0.2% |
| Driver Fitness | 140 | 1.2% |
| Hazardous Materials | 109 | 1.0% |
Wyoming
Inspections: 4,565
Violations: 4,432
| BASIC Violation Group | Violations | % of Total Violations |
| Unsafe Driving | 766 | 17.3% |
| Hours-of-Service | 1,118 | 25.2% |
| Vehicle Maintenance | 2,373 | 53.5% |
| Substance & Alcohol | 31 | 0.7% |
| Driver Fitness | 115 | 2.6% |
| Hazardous Materials | 29 | 0.7% |